Measuring greenhouse gas emissions is becoming a core part of how organisations plan, operate and communicate. As a result, it’s no longer just about compliance. Reliable emissions data, and how you report it, helps you assess risk, prepare for regulation, and make better long-term decisions. It also gives investors, customers, and stakeholders the transparency they increasingly expect.
Most companies now use the Greenhouse Gas Protocol, developed by the World Resources Institute (WRI) and the World Business Council for Sustainable Development (WBCSD). It remains the most widely used standard for corporate emissions accounting and sits at the heart of frameworks like CDP and the Science Based Targets initiative (SBTi).
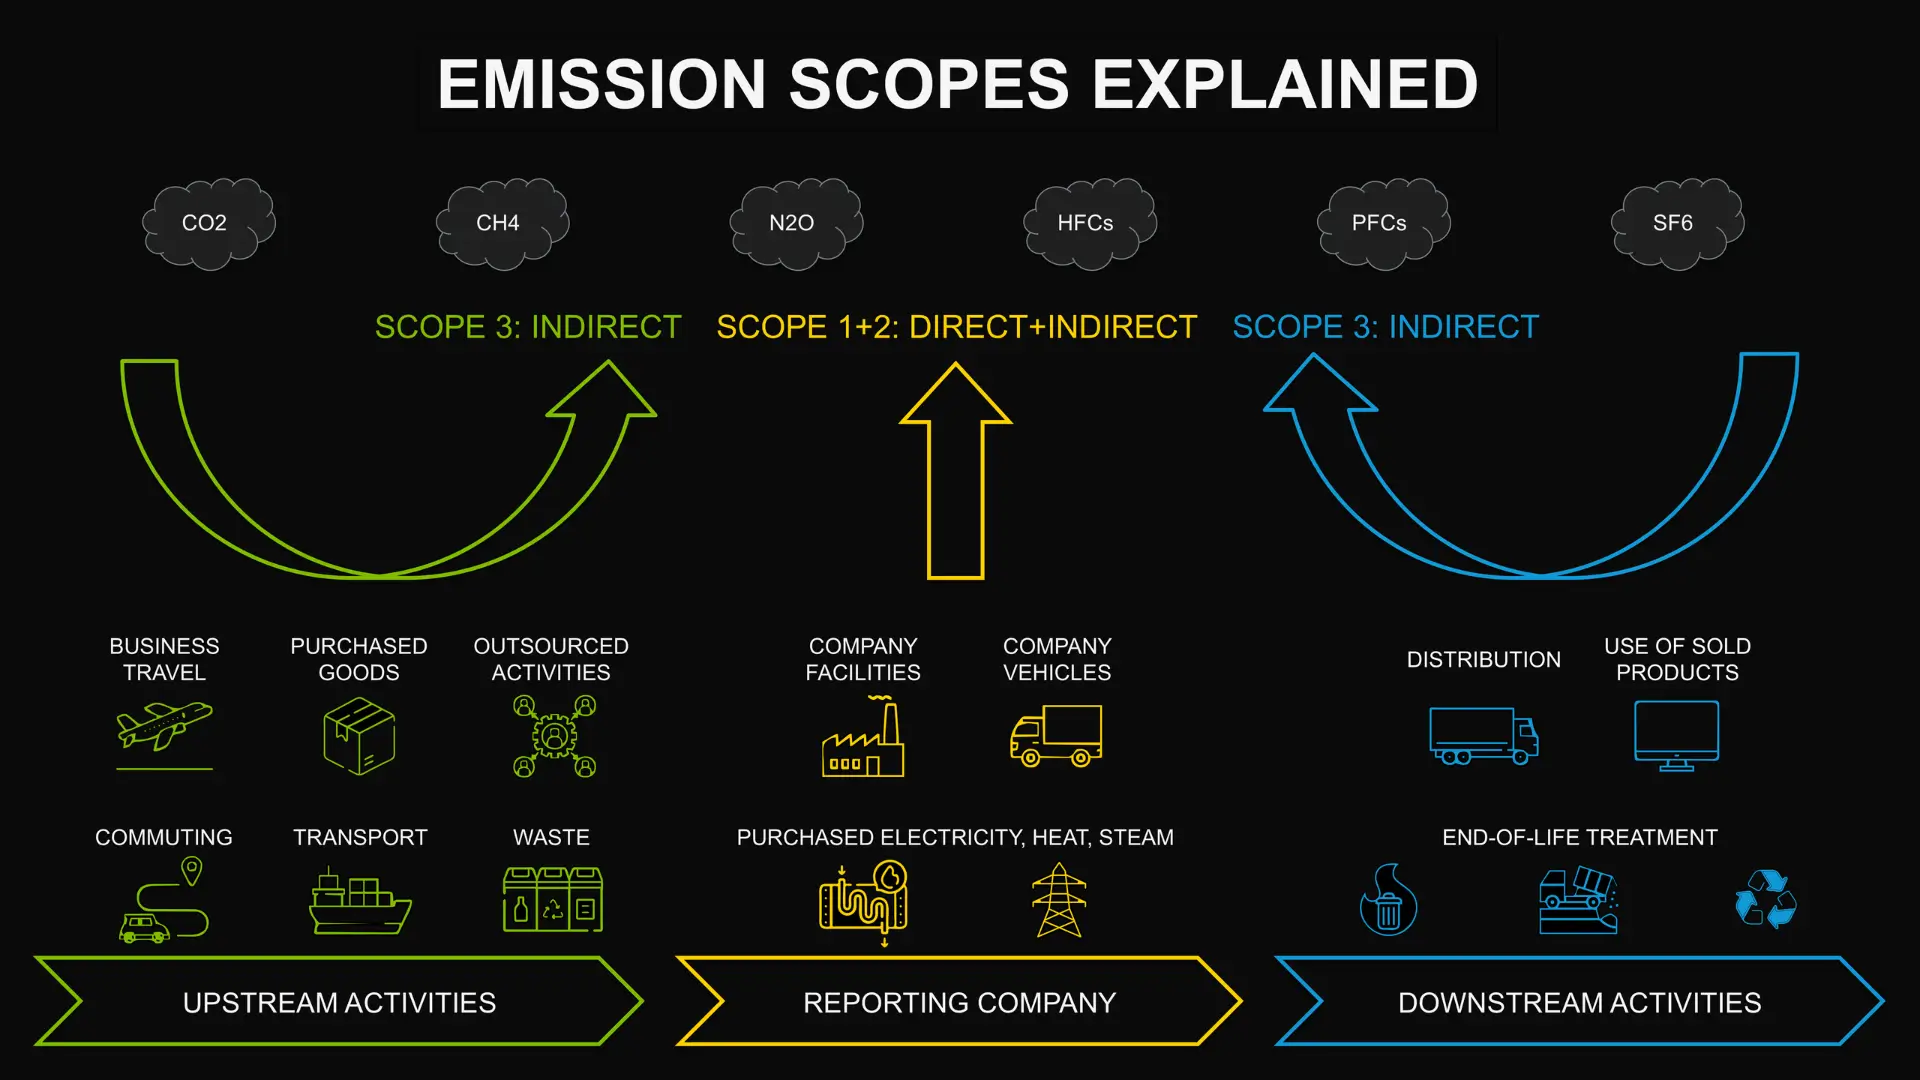
At the centre of the GHG Protocol are the three scopes of emissions: Scope 1, Scope 2, and Scope 3. Together, they help organisations map their direct and indirect impact across the value chain. Getting this structure right is the first step toward building credible, data-driven climate strategies.
Before You Start: Set Your Organisational Boundary
Before you measure Scope 1, 2 and 3 emissions, you need to define your organisational boundary. This means deciding which parts of your business are included in your carbon footprint.
In practice, this covers operations you own or control, such as subsidiaries, facilities, joint ventures or leased assets. Without a clear boundary, your reporting can look complete on paper while still missing important parts of your footprint.
The Greenhouse Gas Protocol allows three approaches to defining this boundary (equity share, financial control, operational control). What matters most is choosing the approach that reflects how your business operates and applying it consistently over time.
This step also helps resolve common grey areas early. For example, emissions from leased buildings or vehicles can sit in different scopes depending on how control is defined. Clarifying this upfront avoids gaps and inconsistencies later.
Once your boundary is set, you can map emissions across Scope 1, 2 and 3 with greater confidence.
Scope 1: Direct Emissions from Sources You Control
Scope 1 covers all direct emissions from operations that an organisation owns or controls. These are usually the easiest for you to measure because the activity happens on site, within familiar processes.
Scope 1 includes emissions from:
1. Stationary combustion, such as boilers, furnaces, and turbines
2. Mobile combustion, from company-owned vehicles
3. Process emissions, such as those in cement or chemical production
4. Fugitive emissions, including refrigerant leaks or methane escape
For energy-intensive sectors, these emissions can be significant. Even if your footprint is relatively small, Scope 1 gives you a clear starting point: what sits within your control.
When you start looking at Scope 1 in practice, a few common questions usually come up.
What typically gets missed in Scope 1?
Fugitive emissions are a common gap, especially refrigerants from cooling systems. They don’t always show up in energy data, so they’re easy to overlook.
Process emissions can also be missed. These come from chemical or physical reactions, not fuel use. If your operations involve production steps like this, it’s worth checking early how those emissions are tracked.
What if we don’t have perfect fuel data?
Start with what you have. Invoices, meter readings, fleet data all help build a solid first picture. What matters most at this stage is being consistent and clear about your assumptions. You can improve accuracy over time.
Scope 2: Indirect Emissions from Purchased Energy
Scope 2 represents the emissions created when the energy an organisation buys is generated. That can include electricity, steam, heating, or cooling. Although these emissions don’t occur on site, they are still driven by your energy use and purchasing decisions.
The GHG Protocol recognises two ways of reporting Scope 2 emissions:
1. Location-based: using the average grid emissions in the region
2. Market-based: using emissions linked to specific energy contracts or purchases, such as renewable electricity
Together, these two perspectives give you a clearer view of your energy impact and how procurement choices can drive change over time. In many cases, Scope 2 becomes one of the fastest areas to decarbonise through efficiency improvements or renewable energy sourcing.
Scope 2 is usually more straightforward, but a few questions still come up in practice.
If we buy renewable electricity, can we report zero emissions?
Sometimes, but it depends on the quality of the evidence behind it. What matters is transparency. Be clear about what sits behind the number and how it has been calculated.
Which Scope 2 number should we use for targets?
It depends on your reporting context and your goals. The key is to choose an approach, apply it consistently, and explain it clearly. Changing methods without explanation can quickly undermine credibility
Scope 3: Indirect Emissions Across the Value Chain
Scope 3 covers all other indirect emissions linked to an organisation’s activities. These occur outside direct control but within the wider value chain. They are grouped into 15 categories, covering most upstream and downstream impacts.
Scope 3 includes:
1 Purchased goods and services
2. Capital goods
3. Fuel- and energy-related activities (not included in Scope 1 or 2)
4. Upstream transportation and distribution
5. Waste generated in operations
6. Business travel
7. Employee commuting
8. Upstream leased assets
9. Downstream transportation and distribution
10. Processing of sold products
11. Use of sold products
12. End-of-life treatment of sold products
13. Downstream leased assets
14. Franchises
15. Investments
For many organisations, Scope 3 is the largest portion of total emissions, often more than 70%. It’s also the most challenging to measure. Scope 3 requires collaboration, estimation, and often new data relationships with your suppliers and partners. But despite the complexity, it shows where emissions are really concentrated, making it central to effective climate planning. Scope 3 often determines the credibility of your overall emissions reporting.
Scope 3 is where most questions tend to arise, especially early on.
Do we need to calculate all 15 Scope 3 categories?
Not always in detail from day one. A good starting point is to screen all categories, identify what is material, and focus your effort where the impact is highest.
How do we start Scope 3 without supplier data?
Start with estimates that are good enough to highlight hotspots. From there, you can prioritise supplier engagement where better data will actually influence decisions.
How do we avoid double counting in Scope 3?
Some overlap between companies is normal at a system level. What matters is keeping your own inventory consistent. Clear category boundaries and documented assumptions go a long way.
Why Scopes Matter for Clear, Comparable Emissions Reporting
The scope structure is there to make a complex system easier to manage. Businesses operate across networks of suppliers, products, and markets and emissions can come from materials, transport, operations, or the way a product is eventually used. Without a shared language and boundary framework, it would be impossible to compare data or plan effectively.
The three scopes offer several practical advantages:
1. They create consistency, making it possible to compare emissions reporting across companies and sectors.
2. They help organisations conduct materiality assessments, so climate efforts focus where the impact is greatest.
3. They provide the basis for science-based target setting, which relies on accurate baseline emissions.
4. They support supply chain engagement, helping teams understand where cooperation is needed.
In practice, it turns a web of activities into something you can actually manage.
From Accounting to Strategy: Using Scope 1, 2 and 3 Data in Practice
You don’t need to wait for perfect data to start taking action, but establishing a baseline early helps you understand where to focus and how to track whether changes are actually reducing emissions over time.
Once you have measured your Scope 1, 2, and 3 emissions, the next step is integrating them into decision-making. This is where carbon accounting starts to inform real decisions.
Accurate scope data supports:
1. Science-based target development, aligned with 1.5°C pathways
2. Decarbonisation roadmaps, grounded in real operational and value chain insights
3. ESG reporting, including CDP, TCFD, CSRD, and SEC disclosures
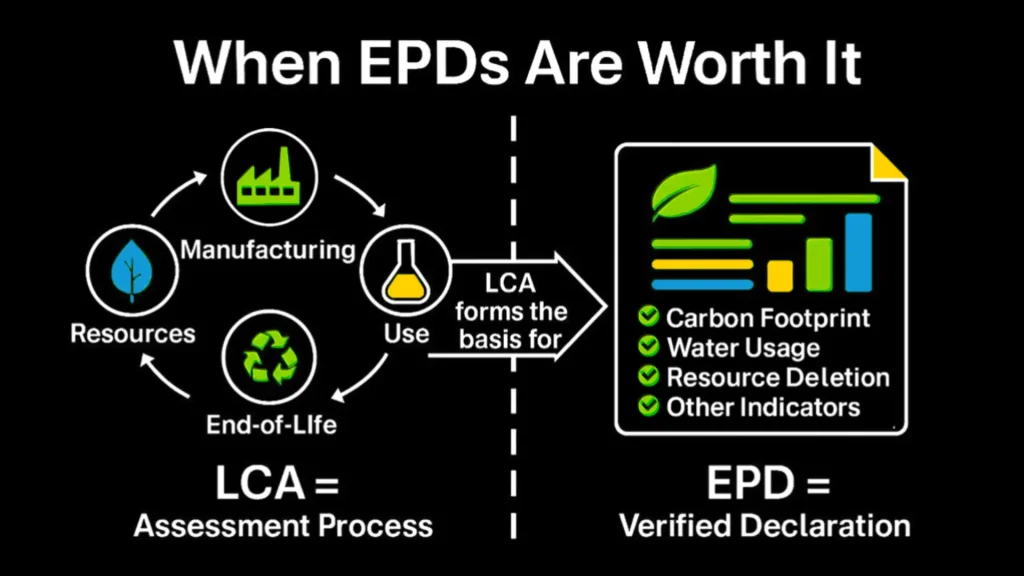
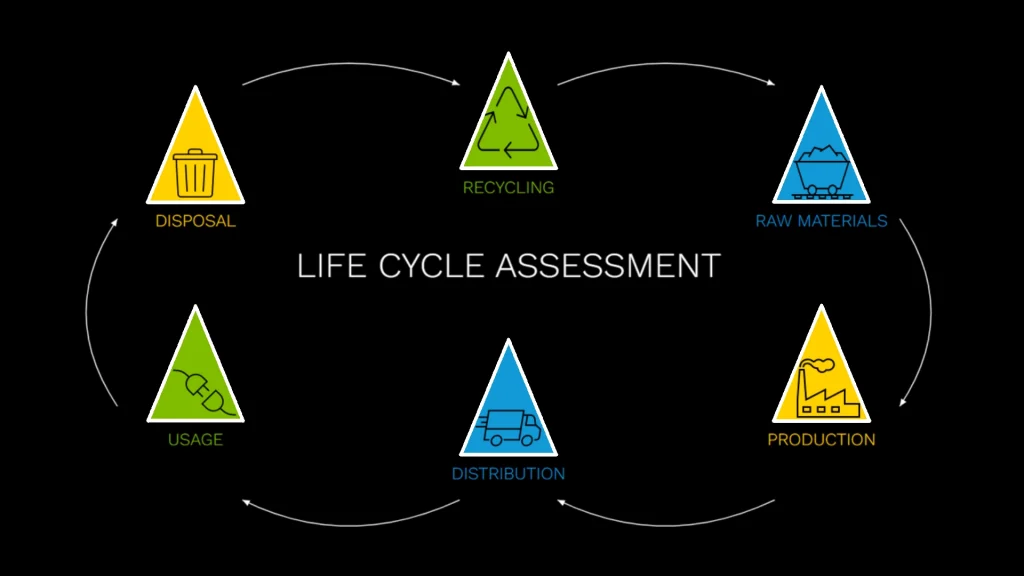
4. Life Cycle Assessment (LCA) work, which benefits from aligned corporate and product data
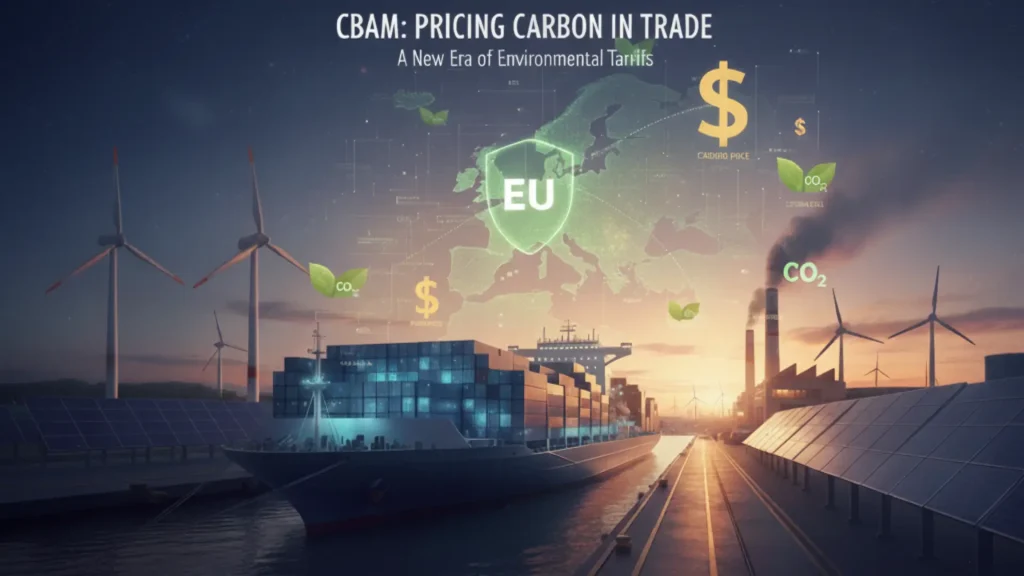
5, Risk planning, especially around supply chain disruption, carbon pricing, and regulatory change
With the right data, you can start to identify where improvements are achievable now, where longer-term investment will be needed, and where collaboration is the only path forward.
Making Progress: What Reducing Scope 1, 2, and 3 Looks Like in Practice
Reducing emissions rarely follows a single path, and your approach will likely combine several actions: operational changes, supplier engagement, product design adjustments, and smarter purchasing decisions.
Examples include:
1. improving energy and process efficiency
2. switching to renewable electricity
3. electrifying fleets or equipment
4. working with suppliers on material impacts
5. redesigning products to reduce impact during use or at end of life
6. choosing lower-carbon transport options
7. setting expectations for procurement teams
8. exploring circularity or take-back models
Not every action delivers immediate results, but together they build momentum. What matters most is direction, consistency, and your willingness to align decisions with long-term goals.
These topics raise a lot of practical questions once organisations start measuring. We’ve compiled the most common ones into a short FAQ .
Download the Scope 1, 2 and 3 FAQ (PDF)
How Aria Sustainability Supports Organisations Through This Process
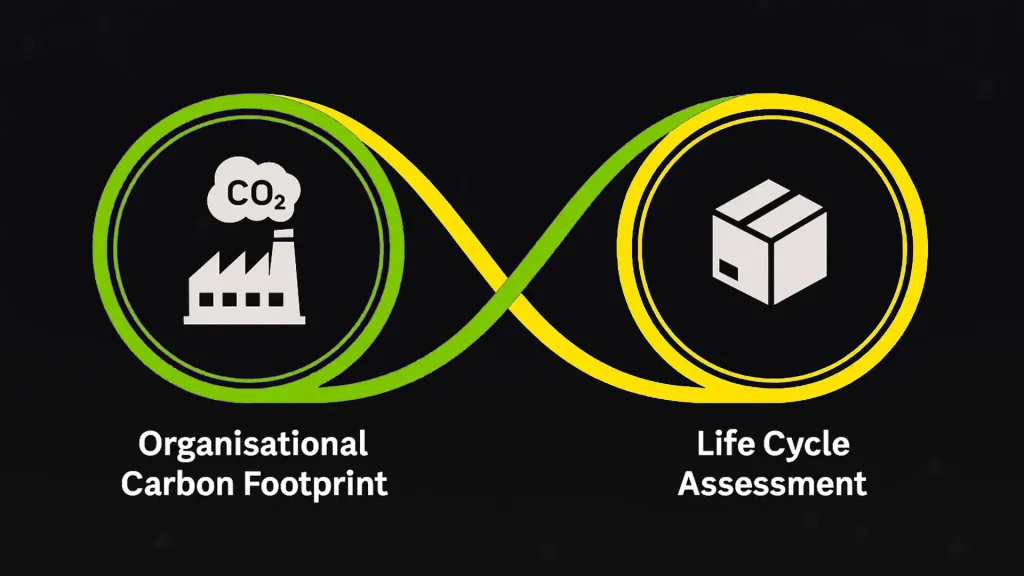
At Aria Sustainability, we help organisations turn scope-level accounting into a practical foundation for action. That includes building accurate inventories, improving Scope 3 data quality, and connecting corporate carbon accounting with product-level work such as Life Cycle Assessment.
Our approach focuses on collaboration and data you can actually use, not just report. We help teams understand where emissions come from, what can be influenced directly, and where wider engagement will be essential. The goal is to support decisions that are credible, realistic, and meaningful for both the business and the climate.
If you’re developing your first GHG inventory or strengthening an existing one, we’re here to help you build a system that’s reliable today and ready for what’s next.