Scope 1 is usually described as the most straightforward part of a carbon footprint but it is also surprisingly easy to get wrong.
The definition sounds simple: Scope 1 emissions are the greenhouse gas emissions released directly from sources your organisation owns or controls.
Think fuel burned in boilers and company vehicles, emissions from industrial processes and refrigerants leaking from cooling equipment.
The tricky part is knowing which sources to include in your inventory in the first place. You might have every gas invoice and fleet fuel record neatly and still underestimate your Scope 1 emissions because nobody asked Facilities about refrigerant top-ups, or Operations whether a backup generator had been running.
This guide explains what counts as Scope 1, which sources are often missed, and what data you need to calculate emissiones.
Scope 1 emissions fall into four main categories: stationary combustion, mobile combustion, process emissions and fugitive emissions.
One common mistake is to assume that energy bills tell the whole story. Start by defining the sources your organisation owns or controls, then work out which categories apply and what activity data you have for each.
Less obvious sources can be easy to overlook, particularly when the information sits with another team or isn’t included in your usual report process.
What are Scope 1 emissions?
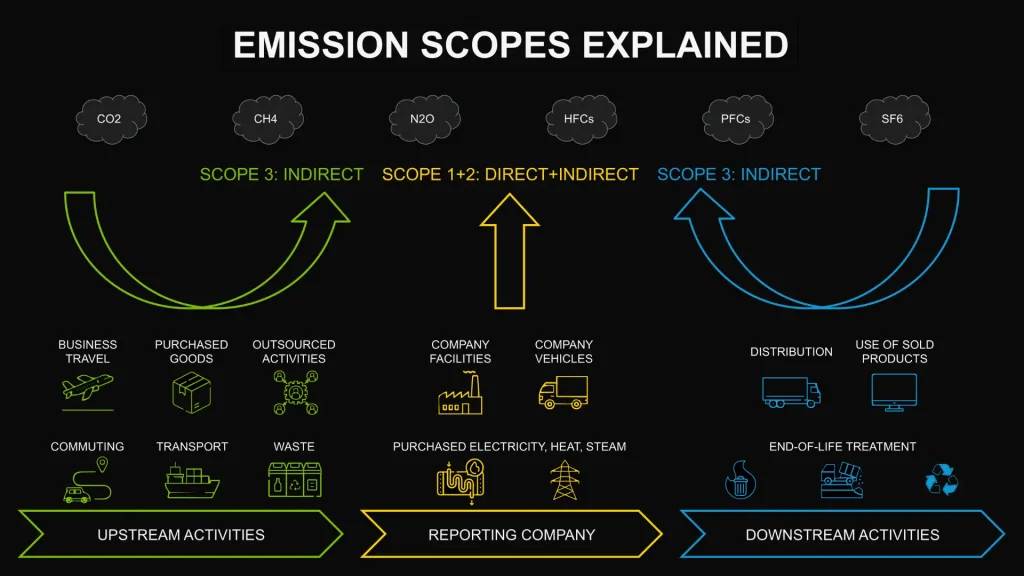
Under the GHG Protocol Corporate Standard, Scope 1 covers direct greenhouse gas emissions from sources owned or controlled by the reporting organisation.
The important part is owned or controlled:
- Natural gas burned in a boiler you operate is Scope 1;
- Purchased electricity is normally Scope 2;
- Employee commuting, business flights and many supplier emissions sit in Scope 3.
Getting this boundary right is the first step. Before you calculate your emissions, you need to know which belong in your inventory.
The four main sources of Scope 1 emissions
1. Stationary combustion
Stationary combustion covers fuel burned in fixed equipment your organisation owns or controlls. Common examples include:
- Gas boilers;
- Furnaces and kilns;
- Oil or LPG heating;
- Onsite generators;
- Industrial combustion equipment.
For many offices and commercial buildings, a gas boiler may be the main source of stationary combustion emissions. If you work in manufacturing, the picture can be more complex, particularly if production involves several types of fuel-burning equipment.
It is also easy to overlook smaller sources, such as backup generators, temporary heating equipment and boilers at secondary sites.
Start by identifying the fuel-burning equipment within your organisation’s reporting boundary during the reporting period. Then check which fuels were used and what activity data you have for each source. Don’t assume the main building’s energy bills tell you everything.
2. Mobile combustion
Mobile combustion covers fuel burned by vehicles and other mobile equipment owned or controlled by the organisation. Typical Scope 1 emissions examples include:
- Company cars and vans;
- HGVs;
- Forklifts;
- Company-owned machinery;
- Onsite mobile equipment.
Fleet fuel records are a good starting point, but they might not cover everything. Forklifts, site vehicles and machinery can be managed by different departments, with fuel use recorded separately from the main fleet. Check which vehicles and mobile equipment fall within your reporting boundary, including anything outside the central fleet. Then compare your list with the fuel records you have.
This helps you spot gaps before calculating your Scope 1 emissions.
3. Process emissions
Not all direct emissions come from burning fuel: some greenhouse gases are released directly by industrial or manufacturing processes. And this can be relevant in sectors such as:
- Cement and lime;
- Chemicals;
- Metals;
- Other manufacturing processes involving greenhouse-gas releases.
For many organisations, process emissions may not be relevant. For others, they can make up a significant part of the carbon footprint.
It’s easy to assume that all Scope 1 emissions come from energy use, but that isn’t always the case. Think about what your organisation produces and how those processes work. Could they release greenhouse gases directly, rather than through burning fuel? If so, you may need to include process emissions in your Scope 1 inventory. An energy-data template alone may not capture all your process emissions, so check that your data collection reflects how your organisation actually operates.
4. Fugitive emissions
Fugitive emissions are greenhouse gases that escape directly from equipment or systems, rather than being released through fuel combustion or an intended industrial process. For many businesses, the most relevant examples involve refrigerant leaks from:
- Air-conditioning systems;
- Refrigeration units;
- Chillers;
- Heat pumps;
- Cold-storage equipment.
These emissions can be easy to miss because they may not appear on energy bills or in fuel records. Instead, the information may be tucked away in maintenance reports. For example, a contractor might record that a cooling system was topped up with refrigerant, but that information never reaches the sustainability team.
Check your maintenance records and speak to Facilities or your external contractors. Find out whether refrigerant was added during the reporting period, and whether you have enough information to calculate the associated emissions.
Refrigerant top-ups can help you estimate emissions, but they don’t automatically tell you the full extent of any leakage. Use the data available and an appropriate calculation method, and document any assumptions you make.
This is why it’s worth looking beyond energy bills when building your Scope 1 inventory. The information you need may already exist, but you might need to ask the right people to find it.
Scope 1 emissions examples by business type
What counts as Scope 1 depends on how your organisation operates. The examples below illustrate some of the sources to look out for, but they won’t cover every situation.
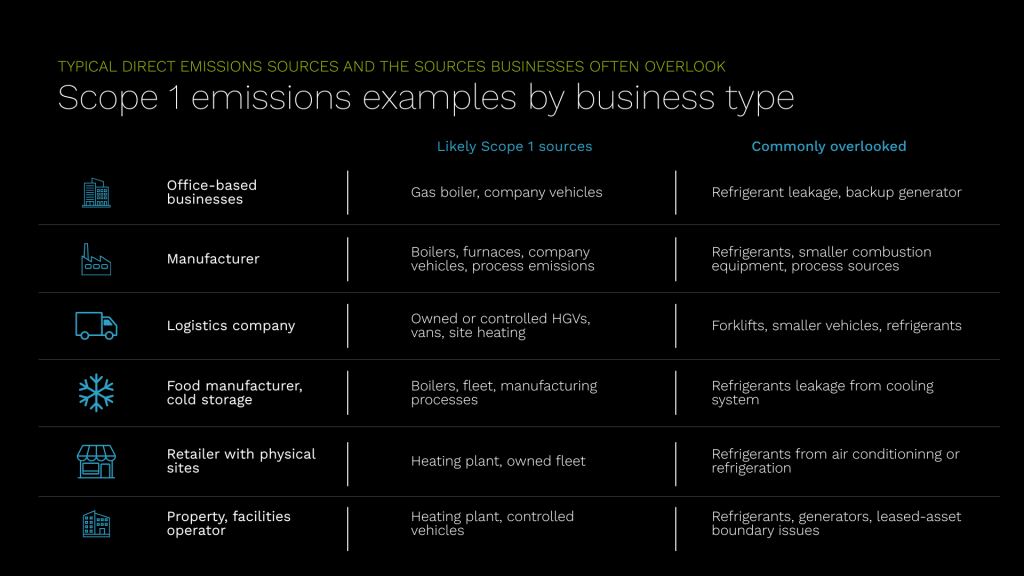
Use these examples as a starting point, then check what applies to your own operations. Two organisations of similar size can have very different direct-emissions profiles, so copying another company’s Scope 1 checklist won’t necessarily give you the full picture.
What is not Scope 1?
Not every emission linked to your operations belongs in Scope 1. Purchased electricity is normally Scope 2, while employee commuting, business travel and supplier emissions generally sit in Scope 3.
The key question is whether the emissions come from a source your organisation owns or controls, in line with the organisational boundary you’ve chosen for your reporting.
If you’re unsure how the three scopes differ, take a look at our guide to Scope 1, 2, and 3 emissions.
How are Scope 1 emissions calculated?
Once you’ve identified the relevant sources and gathered the necessary activity data, you can calculate your emissions using this basic formula: Activity data × appropriate emission factor = greenhouse gas emissions
For UK operations, you can use the UK Government’s greenhouse-gas conversion factors for company reporting. Choose the factors that match your reporting year and the activity you’re calculating.
The calculation itself is only part of the job. You also need to make sure you’ve included all relevant sources and can trace your activity data back to the right site, asset and reporting period.
For each significant Scope 1 figure, ask yourself:
- Where did the data come from?
- Which source or asset does it relate to?
- Which reporting period does it cover?
- What assumptions did we made?
Keep a record of where your data comes from, which emission factors you use and any assumptions you make. That way, you can explain your Scope 1 figures and update them more easily next year.
How ARIA can help
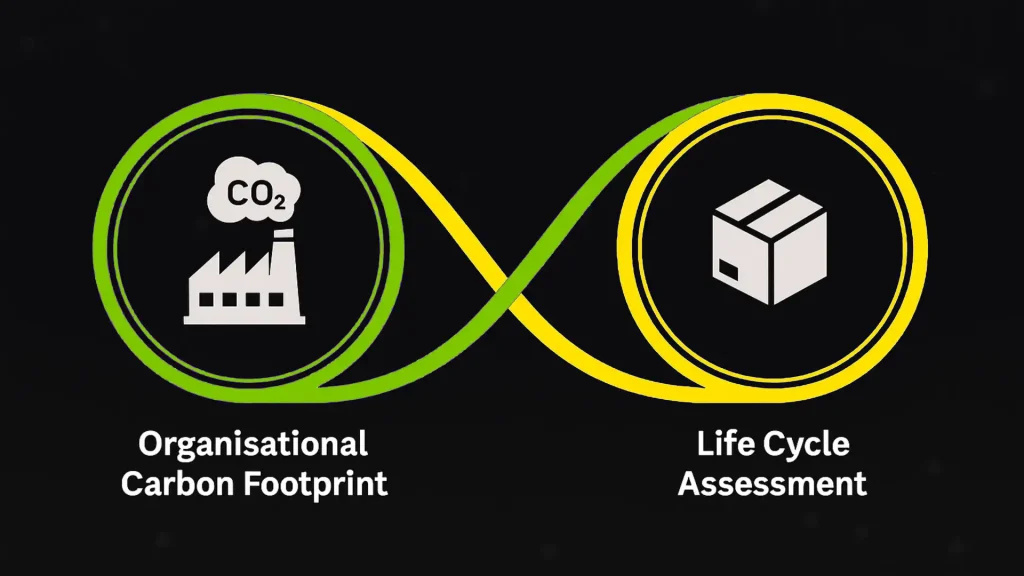
Working out your Scope 1 emissions starts with knowing which sources belong in your inventory and having the right data to calculate them. We can help you define your organisational boundaries, identify the emissions sources you need to include and build a clearer picture of your organisational carbon footprint.
Need help with your Scope 1 emissions? Get in touch with Aria Sustainability to discuss how we can support your carbon accounting and decarbonisation work.
Frequently Asked Questions
Below you’ll find answers to the most frequently asked questions about Scope 1.
Is natural gas Scope 1?
Yes. Where your organisation burns natural gas in equipment it owns or controls, such as a boiler or furnace, the resulting direct emissions are generally Scope 1.
Are company vehicles Scope 1?
Fuel burned by vehicles owned or controlled by the organisation is generally Scope 1.
Are refrigerants Scope 1 emissions?
Refrigerant gases released from equipment within your organisational boundary can be Scope 1 fugitive emissions. This is why maintenance and top-up records can be an important data source.
Can a company have zero Scope 1 emissions?
Potentially, yes. But before declaring zero, check for sources such as refrigerants, backup generators, small combustion equipment and controlled vehicles.