Calculating your value chain emissions and reporting them are not quite the same exercise.
A calculation produces a number, Scope 3 emissions reporting
also explains how that number was calculated, what was included or excluded, which methods were used and where estimates remain. This is what allows someone reviewing the inventory to understand the result and assess its reliability.
Many first inventories struggle with this second part. The calculation may be mathematically sound, but if nobody can understand how the number was built, it becomes difficult to use for a customer request, target setting, disclosure or a meaningful decarbonisation programme.
This guide explains how to build a Scope 3 inventory that is not only calculated, but can be used with confidence.
Long story short: screen all fifteen categories before deciding where to invest effort. Refine the categories that matter. Choose an appropriate calculation method based on the decision the data needs to support. Document your boundaries, sources, estimates, exclusions and assumptions. Then report the information in the format its intended user actually requires.
The aim is a Scope 3 inventory you can explain, update consistently and use to identify where emissions reductions will have the greatest impact.
What Scope 3 reporting actually involves
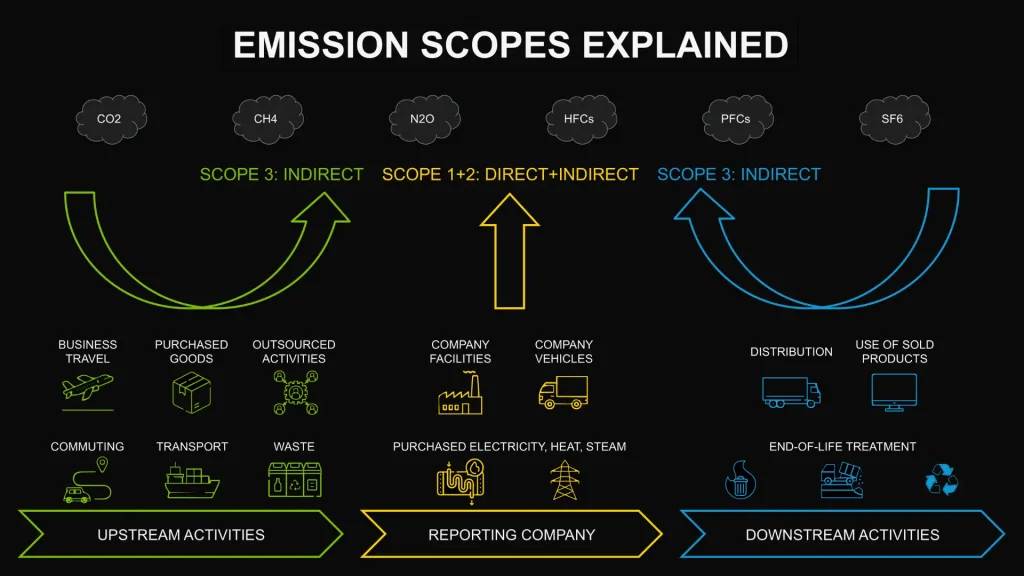
Scope 3 emissions are the indirect greenhouse gas emissions that occur across an organisation’s value chain, outside sources it owns or directly controls.
We spoke about this in our last article; the GHG Protocol Corporate Value Chain Standard organises them into fifteen upstream and downstream categories and recommends screening across the value chain before deciding where more detailed data collection is justified.
For many organisations, Scope 3 represents the largest part of their overall carbon footprint. It is also usually the most difficult part to understand because relevant data can sit across procurement records, suppliers, logistics providers, customers and assumptions about how products are used and disposed of.
This is why Scope 3 reporting is not simply a data-collection exercise.
Done properly, it helps you identify which categories drive emissions, where better data would be worth the effort and where to focus if you’re trying to reduce emissions.
The 15 Scope 3 emissions categories
You should not assume that every category matters equally to your organisation. The first task is to understand which ones apply and where emissions are likely to be concentrated.
- Purchased goods and services
- Capital goods
- Fuel- and energy-related activities not included in Scope 1 or 2
- Upstream transportation and distribution
- Waste generated in operations
- Business travel
- Employee commuting
- Upstream leased assets
- Downstream transportation and distribution
- Processing of sold products
- Use of sold products
- End-of-life treatment of sold products
- Downstream leased assets
- Franchises
- Investments
For manufacturing and product-led businesses, purchased goods and services can often be highly material, while the use phase may dominate for products that consume significant energy during their lifetime. The answer depends on the organisation, its products and its business model.
That is why screening comes first.
Step one: screen every category
A Scope 3 screening exercise gives you an initial estimate of the emissions associated with each relevant category.
At this point, precision is not the objective. You may begin with readily available information such as procurement spend, material quantities, headcount, transport activity or other proxy data. The aim is to identify which categories are likely to drive your footprint before you spend time and money collecting more detailed data.
In many inventories, a smaller group of categories will prove substantially more material than the rest — but there is no fixed number. Which categories dominate depends entirely on the organisation.
The GHG Protocol recommends prioritising refinement according to factors including emissions magnitude, reduction opportunities, business goals, data availability, data quality and the cost and effort involved in obtaining better data. In practice, there is little value in spending weeks improving a category that contributes 1% of the total footprint.
Screening helps in two important ways:
First, it stops your team spending months improving data that will not materially change the picture.
Second, it creates the basis for a decarbonisation pathway. Once you understand where emissions are concentrated, you can begin asking which categories can actually be influenced, where supplier engagement matters and where operational or product changes may create meaningful reductions.
Step two: choose the right data method
There is no single data method that should be used everywhere: the right method depends on the category, the data available and what you need the result to do.
The GHG Protocol provides several calculation approaches and explicitly allows different methods to be used for different activities within the same category where appropriate.
Spend-based data
A spend-based calculation converts expenditure into emissions using an emissions factor per unit of currency.
It is fast and often useful for initial screening, particularly where more specific data is unavailable.
Its limitation is that the result is strongly influenced by price.
If supplier prices increase, your calculated footprint can increase even if the physical activity (and potentially the actual emissions) has not. Conversely, the figure can move for financial reasons that have very little to do with decarbonisation.
That makes spend-based data useful for finding hotspots, but much weaker for demonstrating whether specific decarbonisation interventions are actually working.
Average-data methods
Here, physical activity data (such as tonnes of material, kilometres travelled or litres consumed) is combined with an appropriate average emission factor. Because the calculation is linked to physical activity rather than financial spend, it can provide a more useful basis for tracking operational change.
Supplier-specific data
Supplier-specific data uses information relating to the actual supplier, product or activity concerned.
Where reliable data is available, this can provide a much stronger view of changes taking place within the supply chain and can be particularly valuable for the suppliers or materials that dominate a category.
But collecting it takes time.
You don’t need to ask every supplier for detailed emissions data. Better data is not the objective. The objective is to make better decisions. If improved data would not change what you do, it may not be worth spending months collecting it.
Scope 3 emissions example: an illustrative manufacturer profile
Consider the following simplified example for a mid-sized manufacturer.
This is a hypothetical illustration only. Every organisation’s screening exercise will produce a different result.
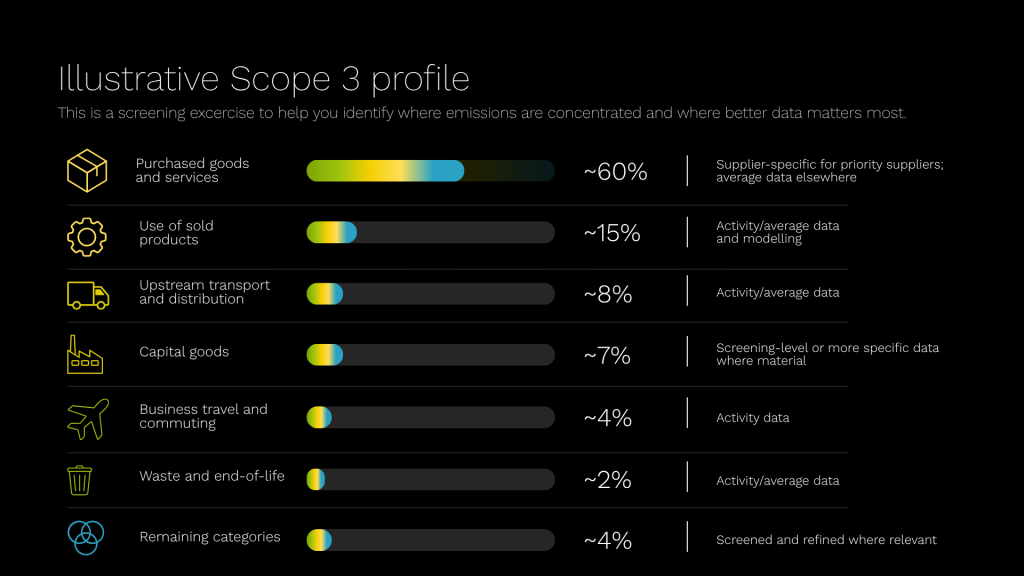
In this illustrative example, Scope 3 happens to represent around 85% of the organisation’s combined emissions and two categories account for most of that total.
Again, 85% is not a benchmark.
The point of the example is concentration: screening shows you where more accurate data is likely to create value before you invest heavily in collecting it.
Step three: document the inventory properly
This stage is easy to underestimate because it does not create another emissions number.
But documentation is what makes the number understandable, reproducible and defensible.
There is no universal three-point checklist: what needs to be recorded will depend on the organisation, the results and the intended use of the inventory.
At minimum, you should be able to make clear which entities, sites and reporting period are included; which Scope 3 categories apply; what has been excluded and why; which calculation method has been used for each category; which data sources support each category; and where estimates or assumptions have been used.
That information should be available category by category.
If part of a category is based on supplier-specific data and the remainder is estimated, say so. If an entire category relies on an estimate, say that too.
The aim is to make uncertainty visible enough that another person can understand how the result was produced.
This is what makes next year’s exercise an update rather than a reconstruction from scratch.
Step four: report the inventory for the purpose it needs to serve
The same underlying Scope 3 model may ultimately support several different business requirements.
But those requirements do not necessarily ask for the information in the same way.
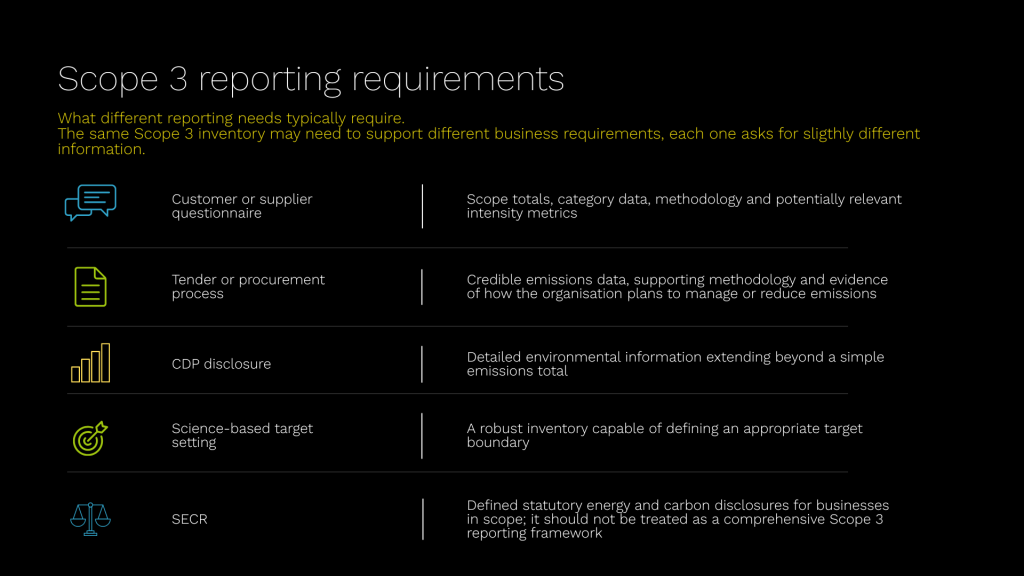
CDP is a good example of why reporting should not be reduced to “fill in the carbon numbers”. Its corporate questionnaire extends into areas including governance, environmental risks and opportunities and, depending on the organisation and disclosure route, environmental topics such as water, forests, biodiversity, plastics and oceans.
Likewise, setting a formal science-based target is not the end of the exercise. It creates a target that then has to be supported by a credible decarbonisation strategy and implementation pathway. Current SBTi guidance also places material emphasis on Scope 3 where it represents a significant part of total emissions.
For UK companies, SECR remains a separate reporting requirement for quoted companies and qualifying large unquoted companies and LLPs. Its mandatory Scope 3 component is much narrower than a full Scope 3 inventory, so the two should not be treated as equivalent.
The practical principle is simple: build the inventory in a way that allows you to answer different reporting requests without starting from scratch every time.
Data quality: what makes a Scope 3 figure credible
Two Scope 3 inventories can arrive at similar totals while having very different levels of usefulness.
A useful inventory makes its data quality visible.
For each material category, the reader should be able to understand how much of the number is based on supplier-specific data, activity-based estimates, spend-based screening or other assumptions. It should also acknowledge uncertainty.
Every Scope 3 inventory contains some level of estimation. Transparency around those estimates does not weaken the report; it helps the reader understand what the figure can and cannot support.
This becomes particularly important when the inventory is being used to demonstrate progress.
If a material category is primarily spend-based, for example, an apparent year-on-year increase may simply reflect inflation or supplier price changes. Before drawing conclusions about environmental performance, you need to understand what is driving the number.
Recalculating the baseline
A Scope 3 inventory is not static.
Organisations change. Acquisitions happen. Products change. Supplier data improves. Calculation methodologies and emissions-factor databases are updated.
The important principle is consistency and transparency.
Your organisation should establish a clear policy for when changes are significant enough to justify recalculating the baseline and should document changes in methodology or data sources that affect year-on-year comparability.
Using an updated database does not automatically create a problem. In some cases, you may decide to update the methodology and rebaseline historical results so the comparison remains meaningful.
GHG Protocol guidance specifically notes that significant improvements in data quality may require recalculating base-year emissions using the improved data sources. The mistake is not changing the method.
The mistake is changing it silently and then presenting the resulting trend as though nothing else changed.
Four failures that make Scope 3 reporting far less useful
Everything stays spend-based
Spend data can be an excellent starting point, but it is a poor end point for the categories you intend to decarbonise.
Prices tend to move over time, so a spend-based footprint can increase even when the underlying activity has not. This makes it difficult to distinguish inflation from genuine emissions performance.
The boundary changes without explanation
An acquisition, disposal, organisational change or methodological update changes what sits inside the calculation.
If this materially affects comparability, the baseline needs to be revisited and the change disclosed.
Exclusions are invisible
A category or activity has been left out because the data was difficult to obtain, but the report does not make the exclusion clear.
A documented limitation can be managed.
An undisclosed one is much harder to defend.
The number is published without the method
A Scope 3 figure with no explanation of boundaries, sources, methods or assumptions has limited value.
It becomes difficult to compare with previous years, difficult to use for decision-making and difficult for another party to assess.
How ARIA can help
ARIA supports organisations through both the technical calculation and the practical decisions around Scope 3 emissions reporting.
We can help you screen the fifteen categories, identify material emissions sources, select appropriate calculation methods, improve data quality and build a documented Scope 3 inventory that can be used for the reporting requirement you are actually facing.
And the work does not have to stop at measurement.
Where appropriate, ARIA can also support CDP reporting, target setting, supplier engagement and decarbonisation planning, helping turn the inventory into a clearer pathway for action.
If you are still establishing how Scope 1, 2 and 3 fit together, start with our Scope 1, 2 and 3 emissions guide.